

The Office of Inspector General (OIG) posted a report dated August 3, 2020 by the same title as this blog as well as this: Consumer Transparency Could Be Increased. The 38-page report as well as the brief are interesting reads.
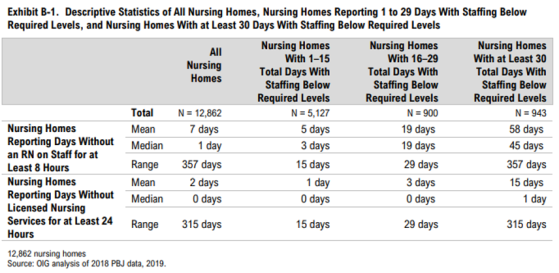
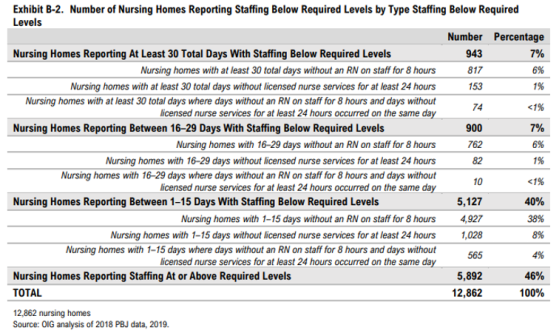
“Of 12,862 nursing homes, 7 percent (943) reported 30 or more days in 2018 on which staffing was below at least 1 required staffing level. Additionally, another 7 percent of nursing homes (900) reported between 16 and 29 days with staffing below required levels in 2018. This raises concerns that some nursing homes may not have fully met their residents' needs in 2018. CMS implemented a policy in 2018 to downgrade nursing homes' Staffing Star Ratings to 1 Star for having at least 7 total days within a quarter with no reported RN time. Following CMS's announcement of this policy, 27 percent fewer nursing homes reported days with no RN time. At the same time, 7 percent more nursing homes reported days with some RN time, although less than the required 8 hours per day. These trends suggest overall improvements in staffing levels. Finally, we found that daily staffing levels reported by individual nursing homes often did not match their Staffing Star Rating published on Nursing Home Compare. While some nursing homes' reported staffing levels varied considerably from day to day, other nursing homes' daily staffing levels were more consistent.”
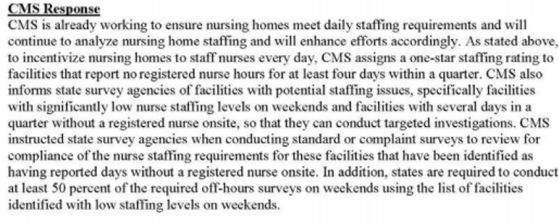
2 OIG recommendations for CMS stemming from this report are:
- Enhance efforts to ensure nursing homes meet daily staffing requirements and
- Explore ways to provide consumers with additional information on nursing homes' daily staffing levels and variability.
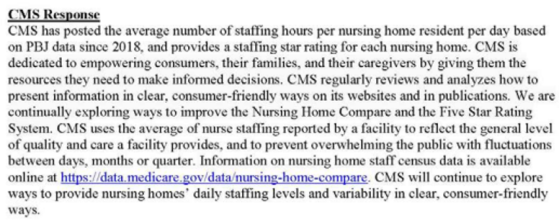
While CMS did not explicitly state concurrence with the recommendations, CMS outlined the actions it has taken and plans to take to achieve the recommendations' goals. CMS Administrator Seema Verma’s response letter begins on page 29 of the report. The CMS response to each is:
and
The OIG Report is one that NH/LTC management should read. The Appendices are also worth your time and thought (there are also very telling graphs and charts to drive home OIG’s comments):
- APPENDIX A: STAFFING STAR RATINGS ON NURSING HOME COMPARE
- APPENDIX B: NURSING HOMES REPORTING STAFFING BELOW REQUIRED LEVELS
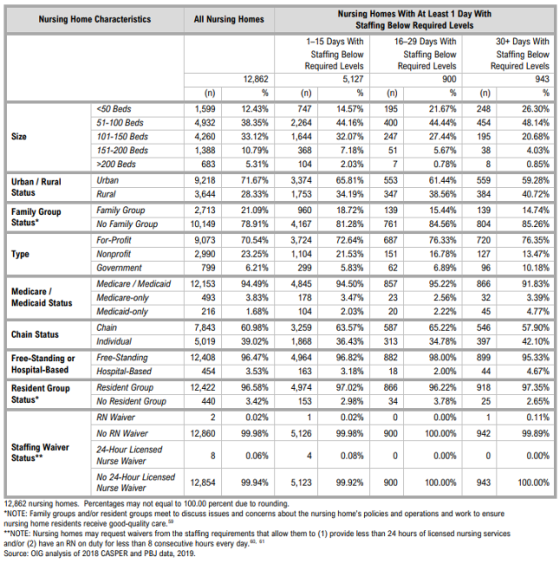
- APPENDIX C: CHARACTERISTICS OF NURSING HOMES REPORTING STAFFING BELOW REQUIRED LEVELS
- APPENDIX D: FREQUENCY OF NURSING HOMES REPORTING REGISTERED NURSE STAFFING BELOW REQUIRED LEVELS AFTER CENTERS FOR MEDICARE & MEDICAID SERVICES’ POLICY CHANGE
- APPENDIX E: QUARTERLY AVERAGE PERCENTAGE OF DAYS WHEN DAILY NURSE STAFFING DID NOT MATCH STAR RATINGS
- APPENDIX F: DAY-TO-DAY DIFFERENCES IN NURSING HOMES’ STAFFING LEVELS (This one definitely merits your consideration!)
- APPENDIX G: AGENCY COMMENTS
Here are a couple of those charts to whet your data appetite:
And there’s this graphic found in Appendix C:
You really need to take a good look at this OIG report then look at your PBJ reports since this review was done. Staffing data is being collected by CMS and it will be used for more than just Nursing Home Compare. How accurate is your data???
If you need help with your staffing data, check out ezPBJ. You’ll be glad you did - they can help!
Want to keep up with the changing COVID-19 situation in skilled nursing?