

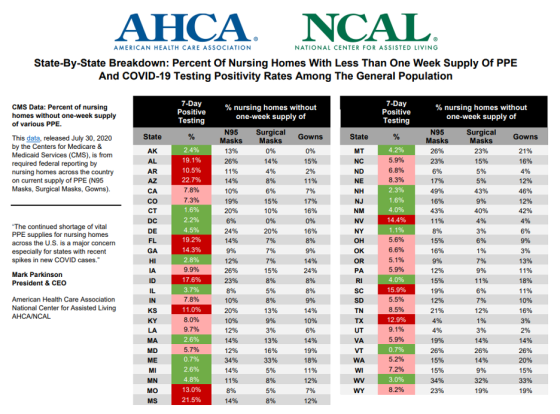
AHCA/NCAL has posted two (2) general population at-a-glance graphics:
- PPE shortages by state and
- COVID-19 positivity
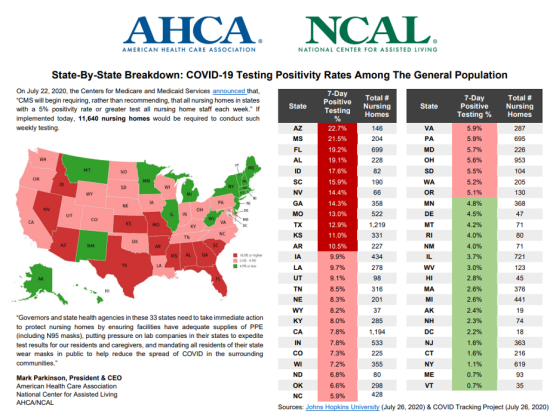
The data displayed on the testing positivity graphic is from July 26, 2020; the source is Johns Hopkins University and the COVID Tracking Project. The percent of NHs with less than one (1) week supply of PPE and testing positivity rates was released July 30, 2020 by CMS and the source is NHSN reporting.
Thank you AHCA/NCAL for these graphics!
Want to keep up with the changing COVID-19 situation in skilled nursing?